

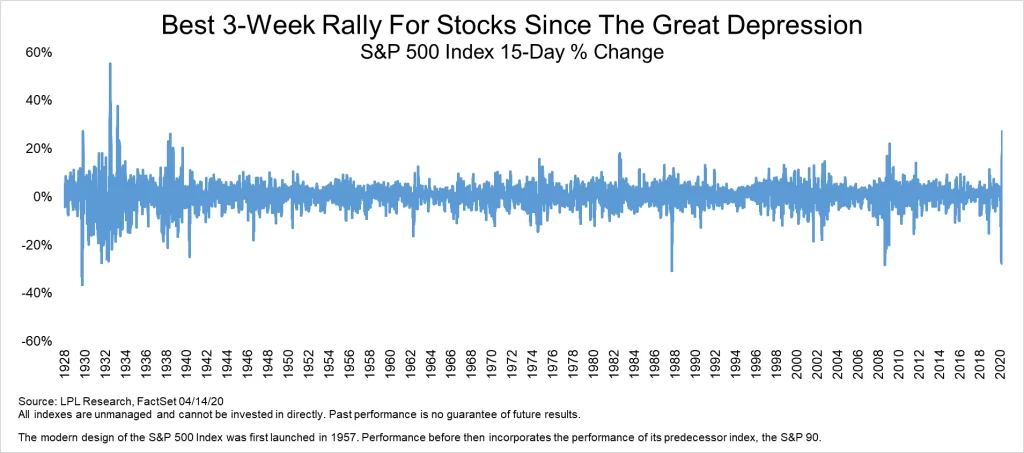
The economic data keeps getting worse, yet stocks have been in the midst of one of the greatest multi-week rallies ever. As the LPL Chart of the Day shows, the S&P 500 Index gained 27.2% in the 15 days after the March 23 lows, the greatest three-week rally since 1933. Take note, this rally took place amid millions of initial jobless claims, while consumer confidence, retail sales, and manufacturing crashed.
“As scary as the headlines have been, stocks are doing well, as they could be trying to sniff out potential better times ahead,” explained LPL Financial Senior Market Strategist Ryan Detrick. “We’ve found that stocks have tended to bottom about five months before a recession ends, so it is actually normal to see stocks improving amid poor economic data.”
In this week’s LPL Street View video, LPL Financial Senior Market Strategist Ryan Detrick discusses these points.
IMPORTANT DISCLOSURES
This material is for general information only and is not intended to provide specific advice or recommendations for any individual. There is no assurance that the views or strategies discussed are suitable for all investors or will yield positive outcomes. Investing involves risks including possible loss of principal. Any economic forecasts set forth may not develop as predicted and are subject to change.
References to markets, asset classes, and sectors are generally regarding the corresponding market index. Indexes are unmanaged statistical composites and cannot be invested into directly. Index performance is not indicative of the performance of any investment and do not reflect fees, expenses, or sales charges. All performance referenced is historical and is no guarantee of future results.
Any company names noted herein are for educational purposes only and not an indication of trading intent or a solicitation of their products or services. LPL Financial doesn’t provide research on individual equities. All information is believed to be from reliable sources; however, LPL Financial makes no representation as to its completeness or accuracy.
The modern design of the S&P 500 stock index was first launched in 1957.
Performance back to 1950 incorporates the performance of predecessor index, the S&P 90.
This Research material was prepared by LPL Financial, LLC.
Securities and advisory services offered through LPL Financial (LPL), a registered investment advisor and broker-dealer (member FINRA/SIPC).
Insurance products are offered through LPL or its licensed affiliates. To the extent you are receiving investment advice from a separately registered independent investment advisor that is not an LPL affiliate, please note LPL makes no representation with respect to such entity.
If your representative is located at a bank or credit union, please note that the bank/credit union is not registered as a broker-dealer or investment advisor. Registered representatives of LPL may also be employees of the bank/credit union.
These products and services are being offered through LPL or its affiliates, which are separate entities from, and not affiliates of, the bank/credit union. Securities and insurance offered through LPL or its affiliates are:
- Not Insured by FDIC/NCUA or Any Other Government Agency
- Not Bank/Credit Union Guaranteed
- Not Bank/Credit Union Deposits or Obligations
- May Lose Value
For Public Use – Tracking 1-00983891